In this article
Quick Summary
- 1Core Web Vitals — LCP, INP and CLS — have been a confirmed Google ranking signal since 2021, and INP replaced FID as the responsiveness metric in March 2024, catching most site owners off guard.
- 2In 2026, roughly 43% of websites still fail the INP threshold of 200 milliseconds, making slow interactivity the single most common reason otherwise-healthy sites lose both rankings and conversions.
- 3A proper Core Web Vitals audit in India typically costs ₹15,000–₹1,50,000 depending on site size, and full remediation runs ₹50,000–₹4,50,000+ depending on how the site was originally built.
- 4Sites that reach “good” on all three metrics typically see measurable ranking and conversion movement within 60–90 days, not overnight.
- 5This guide breaks down what actually drives the cost, what a serious remediation project includes, and the patch-vs-rebuild decision framework we use before quoting a number.
Why Core Web Vitals Became Unavoidable in 2026
We get some version of the same call every month: “our SEO agency says we're losing rankings because of Core Web Vitals, but nobody can tell us what it actually costs to fix.” It's a fair question, and most of the answers floating around online are either recycled boilerplate from 2021 or vague enough to be useless.
Here's the honest 2026 picture. Core Web Vitals have been part of Google's page experience ranking signals since 2021, but the metric set changed in March 2024 when Interaction to Next Paint (INP) replaced First Input Delay (FID) as the responsiveness metric. That change mattered more than most site owners realised at the time — FID only measured the delay before the browser started processing your first click. INP measures the full round-trip for every interaction on the page, from click to visible response, across the entire visit. It's a much harder bar to clear, and it shows: field data across the web in 2026 puts roughly 43% of sites still failing the 200-millisecond INP threshold, making it the most commonly failed of the three Core Web Vitals.
We build and rebuild websites for a living — mostly on React and Next.js — and we treat Core Web Vitals as a ranking issue and a revenue issue in the same breath. A site that fails Core Web Vitals doesn't just rank lower; it loses the visitors who do arrive. If your business depends on organic traffic converting into leads, this isn't an SEO checkbox — it's the same underlying problem as a website that doesn't convert, just measured with different instruments.
The Three Metrics, in Plain English
Google scores a page as “good” when the 75th-percentile of real user visits meets all three thresholds:
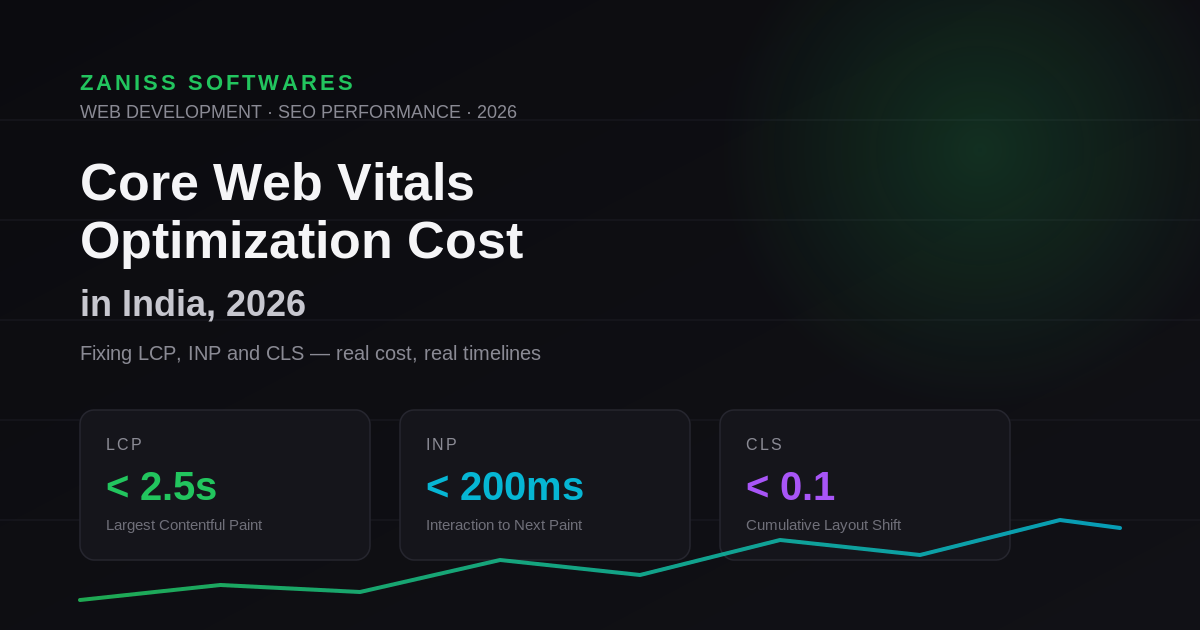
- Largest Contentful Paint (LCP) — under 2.5 seconds. This is how long it takes the biggest visible element (usually a hero image, banner or headline block) to render. Slow LCP is almost always a server response, image, or render-blocking resource problem.
- Interaction to Next Paint (INP) — under 200 milliseconds. This is how long the page takes to visually respond after a user clicks, taps or types anywhere on the page — not just the first interaction, but the worst one during the whole visit. Slow INP is almost always a JavaScript problem: too much code running on the main thread, badly scoped event handlers, or third-party scripts (chat widgets, ad tags, analytics) blocking the browser.
- Cumulative Layout Shift (CLS) — under 0.1. This measures how much visible content jumps around as the page loads — an image that pops in without reserved space, a cookie banner that shoves the page down, a web font swap that reflows text. Users feel this as the page being “janky,” and it's one of the easier metrics to fix once you know where to look.
All three are measured as field data (real users, via the Chrome User Experience Report) rather than lab data (a single test run in PageSpeed Insights or Lighthouse). This distinction trips up a lot of site owners: a page can score 95 in a Lighthouse lab test and still fail Core Web Vitals in Search Console, because lab tests don't capture your actual mix of devices, networks, and third-party scripts running in production.
Why Most Sites Fail — the Root Causes We See Repeatedly
After auditing sites across e-commerce, SaaS and services businesses, the failure patterns repeat far more than most agencies admit:
- Unoptimised hero images and no CDN — a multi-megabyte hero banner served without compression is still the single most common LCP killer we see.
- Render-blocking JavaScript and CSS, especially on WordPress sites carrying five to ten unaudited plugins.
- Third-party scripts running unmanaged — chat widgets, heatmap trackers, ad pixels and marketing tags each add their own execution cost, and most sites never audit what's actually still needed.
- Web fonts without a font-display strategy, causing invisible text or layout reflow.
- No reserved space for ads, embeds or dynamically loaded content — the leading CLS cause on content and media sites.
- Legacy jQuery-era themes retrofitted with modern trackers, common on sites that have been “redesigned” by adding layers instead of rebuilding.
None of these are exotic. They're deferred maintenance, and they compound the same way technical debt does everywhere else in software.
What a Real Core Web Vitals Audit Includes
A proper audit isn't a five-minute PageSpeed Insights screenshot pasted into a slide. What we deliver — and what you should expect from any vendor quoting you a number — covers field data analysis from Search Console and CrUX, a page-type breakdown (home, category, product/service, blog each behave differently), a JavaScript execution profile identifying the specific scripts blocking the main thread, an image and font audit, and a prioritised fix list ranked by effort versus impact, not just a list of everything that's technically wrong.
Typical audit cost in India, 2026:
| Site Type | Pages Typically Profiled | Audit Cost (INR) |
|---|---|---|
| Small business / brochure site | 5–15 pages | ₹15,000 – ₹30,000 |
| Mid-size site (blog, service pages, landing pages) | 20–60 pages | ₹30,000 – ₹55,000 |
| E-commerce (catalog + PDP templates) | 5–10 templates | ₹45,000 – ₹80,000 |
| Enterprise / multi-locale site | 100+ templates & locales | ₹80,000 – ₹1,50,000+ |
The Remediation Framework — What Fixing It Actually Costs
Audits are the easy part. Remediation cost depends almost entirely on how the site was built, not how big it is. A modern Next.js site with clean component boundaries can often hit “good” on all three metrics with two to three weeks of focused work. A ten-year-old WordPress site with layered plugins and theme customisations frequently needs partial rebuilding to get there — and no amount of caching plugins changes that math.
We group remediation into four buckets:
- Image and asset pipeline (LCP). Modern formats (AVIF/WebP), responsive srcset, CDN delivery, and preloading the actual LCP element instead of guessing. Typically ₹15,000–₹60,000 depending on catalog size.
- JavaScript execution (INP). Code-splitting, deferring non-critical scripts, replacing heavy libraries, and auditing third-party tags one by one instead of accepting “marketing needs all of them.” This is usually the most expensive bucket because it requires engineering judgment, not configuration. ₹40,000–₹1,80,000 depending on how much custom JavaScript the site carries.
- Layout stability (CLS). Reserving space for images, ads and embeds, fixing font-loading strategy, and auditing dynamically injected content (cookie banners, promo bars). Usually the cheapest fix category: ₹10,000–₹35,000.
- Infrastructure and hosting. Server response time (TTFB), caching headers, and CDN configuration. If hosting itself is slow, no amount of front-end optimisation closes the gap. ₹15,000–₹50,000 for a hosting and CDN reconfiguration; more if it requires a migration.
Full remediation cost by starting point:
| Starting Point | Remediation Cost (INR) | Typical Timeline |
|---|---|---|
| Modern React/Next.js site, isolated issues | ₹50,000 – ₹1,50,000 | 2–3 weeks |
| Standard WordPress/CMS site, moderate plugin load | ₹1,20,000 – ₹2,50,000 | 4–6 weeks |
| Legacy site or heavy e-commerce catalog | ₹2,50,000 – ₹4,50,000+ | 6–10 weeks |
| Partial rebuild required (architecture is the blocker) | Scoped as a web development project | 8–12 weeks |
That last row matters. We tell clients honestly when patching won't work — when the theme architecture itself is the bottleneck, the responsible recommendation is a scoped rebuild on a modern stack, not another round of plugins layered on a page that was never going to pass.
Planning a Website? Don't Overpay or Underbuild
Most businesses overspend on features they don't need — or underspend and rebuild within a year. We help you scope it right from day one.
The Decision Framework: Patch, Rebuild, or Ignore?
We walk every client through the same three questions before quoting a number:
- Is organic search a meaningful traffic source for you? If most of your leads come from referrals or paid social, Core Web Vitals still matters for conversion but the ranking urgency is lower — this becomes a CRO problem more than an SEO emergency.
- How far are you from “good,” and on which metric? A site failing CLS by a small margin is a days-long fix. A site failing INP badly on a JavaScript-heavy platform is a different conversation entirely — sometimes cheaper to rebuild the template than to keep patching it.
- How old is the underlying build? As a rule of thumb, if your site is more than four years old and has had more than two “redesigns” without a full rebuild, patching Core Web Vitals in isolation usually costs more over 18 months than a scoped rebuild would have cost upfront — because you're paying to work around architecture decisions instead of fixing them.
When Fixes Show Up in Rankings and Revenue
Google doesn't reward a Core Web Vitals fix instantly. Field data (CrUX) is a rolling 28-day window, so it takes at least four weeks after deployment before Search Console reflects the improvement, and ranking movement typically follows another two to six weeks behind that. Conversion rate impact is faster — usually visible within the first one to two weeks post-launch, because that's a direct UX effect, not a crawl-and-index cycle. We tell clients to expect the full picture, rankings and conversion both moving, inside 60 to 90 days, not 60 to 90 hours.
Tools We Use to Measure and Monitor
Free tools get you most of the way for an initial read: Google Search Console's Core Web Vitals report shows field data by URL group, PageSpeed Insights gives you both lab and field data in one screen, and Chrome DevTools' Performance panel is where we actually diagnose the specific JavaScript task blocking INP. Beyond the free tier, sites with meaningful traffic benefit from continuous Real User Monitoring — we typically stand up a lightweight RUM setup so a client can see how a deploy affects field data within days rather than waiting a month for CrUX to catch up. For most SME sites, free tooling plus a quarterly manual audit is sufficient; RUM becomes worth the cost once monthly organic sessions cross roughly 50,000, or once a business ships frequently enough that “did we regress?” needs a same-day answer.
How This Fits Into a Broader Web Strategy
Core Web Vitals rarely show up alone. Sites that fail LCP and INP are frequently the same sites that fail accessibility compliance and underperform on conversion — they're symptoms of the same underlying problem: a site built incrementally over years without anyone owning the architecture. If you're already looking at a Core Web Vitals fix alongside a CRO audit, or wondering whether the smarter move is a rebuild on React or Next.js, it's worth scoping all three together — the fixes overlap more than most agencies admit, because reserving image space for CLS, lazy-loading for LCP, and code-splitting for INP all touch the same components. See our broader website development cost guide if you're weighing a patch against a full rebuild.
What We Do
We run a Core Web Vitals audit as a fixed-price, one-to-two-week engagement, hand over a prioritised fix list with real INR estimates for each item, and — for clients who want us to execute — do the remediation work ourselves in two-week sprints with before/after field data to prove it. We don't upsell a full rebuild when a patch will genuinely hold; we also don't sell a sixth round of patches when the honest answer is that the architecture needs to change.
Related Articles
- [Web Development] Cost of Website Development in India in 2026: A Complete Pricing Guide
- [Web Development] React.js vs Next.js in 2026: Which Should You Build With?
- [Web Development] Web Accessibility (WCAG 2.2) Compliance for Indian Businesses in 2026
- [Digital Marketing] Conversion Rate Optimization (CRO) for Indian Business Websites in 2026
Working With Us
If your site is losing rankings or conversions to slow LCP, sluggish INP or layout shift, we'll run a Core Web Vitals audit and hand you a prioritised, INR-costed fix list — no obligation to hire us to execute it. Our Web Development team builds every new site to pass Core Web Vitals from day one, and fixes existing ones without a ground-up rebuild wherever the architecture allows it. Book a free consultation and we'll tell you honestly whether you need a patch or a rebuild.
Pro Insight
Patch or rebuild? We'll tell you honestly.
We'll run a Core Web Vitals audit and hand you a prioritised, INR-costed fix list — no obligation to hire us to execute it.
- ✓SEO-first architecture
- ✓Conversion-focused design
- ✓High-speed performance
- ✓Scalable, future-proof code
📩 Response within 24 hours
Frequently Asked Questions
What's the difference between Core Web Vitals and a general page speed audit?
Page speed audits look at raw load-time metrics; Core Web Vitals are Google's specific, ranking-linked subset — LCP, INP and CLS — measured from real user field data rather than a single lab test. A site can “feel fast” in a lab test and still fail Core Web Vitals if real users on weaker devices or networks experience it differently.
How much does it cost to fix Core Web Vitals for a small business website in India?
For a brochure or small business site (5–15 pages), audit plus remediation typically runs ₹65,000–₹1,80,000 total, depending on whether the underlying CMS needs deeper JavaScript or image-pipeline work. WordPress sites with heavy plugin stacks land at the higher end.
Can I fix Core Web Vitals myself without hiring an agency?
For CLS and basic image optimisation, yes — a competent developer can resolve most layout-shift issues and compress images in a few days using free tools like PageSpeed Insights and Search Console. INP fixes usually require deeper JavaScript profiling experience, which is where most DIY attempts stall.
How long does it take to see ranking improvement after fixing Core Web Vitals?
Budget 60–90 days for the full effect. Field data needs roughly four weeks to reflect a fix in Search Console, and ranking movement typically follows two to six weeks after that. Conversion-rate improvements from a smoother, faster experience are usually visible sooner — within one to two weeks.
Does Core Web Vitals actually affect Google rankings, or is it overstated?
It's a confirmed ranking signal, but a minor one relative to content relevance and backlinks — it functions more as a tiebreaker and a gate than a primary ranking lever. Its bigger, more measurable impact is on conversion rate: slow, janky pages lose visitors regardless of where they rank.
What happens if my site fails Core Web Vitals but I don't fix it?
Nothing breaks overnight. But you're leaving both organic ranking headroom and conversion rate on the table indefinitely, and the gap tends to widen — every year the average competitor site gets faster, and Google's real-user expectations rise with it.