Quick Summary
- 1INP has replaced FID as the interactivity metric, and it's now the Core Web Vital most Indian business sites fail.
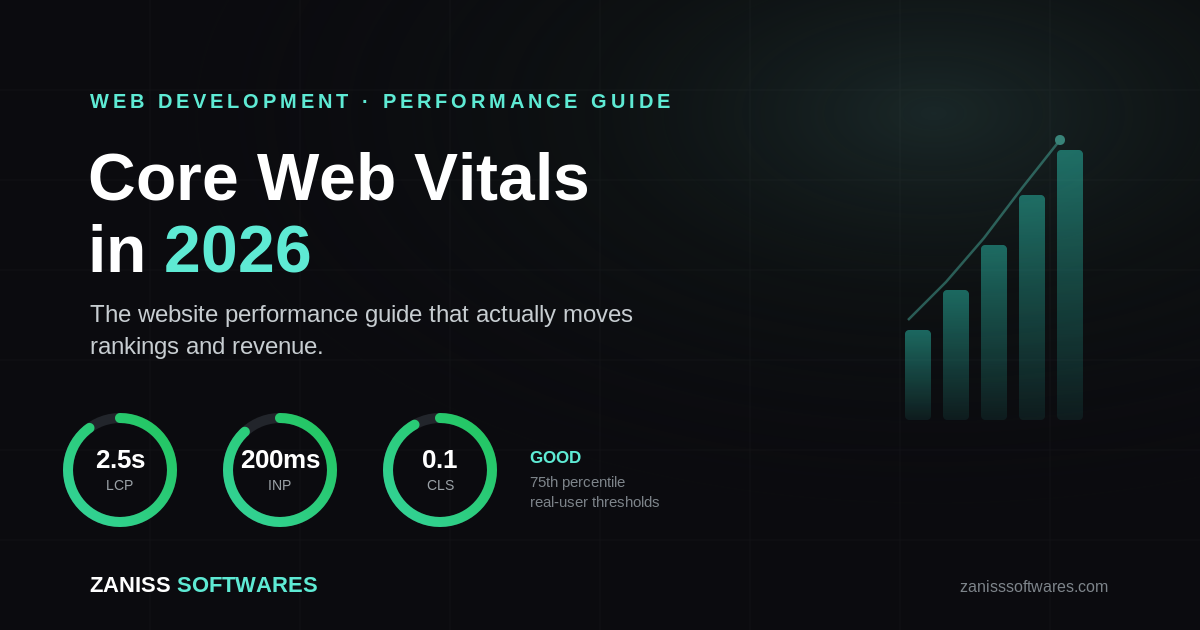
- 2Passing all three vitals (LCP under 2.5s, INP under 200ms, CLS under 0.1) at the 75th percentile is table stakes for both Google rankings and AI Overview citations in 2026.
- 3Most failures on Indian SMB sites trace back to three fixable causes: unoptimized hero images, third-party script bloat, and font-loading layout shift.
- 4A focused two-week performance sprint typically costs ₹35,000–₹1.5L depending on site complexity and recovers a meaningful share of lost conversions without a full rebuild.
We audit a lot of Indian business websites, and the same story keeps repeating. A company invests in a redesign, traffic in Google Analytics looks healthy, and leads still don't move the way anyone expected. Nine times out of ten, part of the answer is sitting inside Google Search Console's Core Web Vitals report, quietly flashing amber or red, while everyone focuses on content and keywords instead.
Core Web Vitals aren't a niche technical concern anymore. They sit inside Google's page experience signals, they increasingly decide which pages get cited inside AI Overviews, and — more concretely for anyone running paid traffic — a slow, janky site taxes every rupee spent on Google Ads and SEO before a single visitor even reads your headline. This is the guide we wish more clients read before, not after, a redesign: what Core Web Vitals actually measure in 2026, how to run a free audit in twenty minutes, what typically breaks on Indian business sites and why, realistic fix costs in INR, and a clear framework for when a focused performance sprint is enough versus when you actually need to rebuild.
What Core Web Vitals actually measure in 2026
Google tracks three metrics, each measured at the 75th percentile of real user visits over a rolling 28-day window pulled from the Chrome User Experience Report (CrUX) — not a single lab test, but how your slowest quartile of real visitors actually experiences the page.
| Metric | What it measures | Good | Needs improvement | Poor |
|---|---|---|---|---|
| LCP (Largest Contentful Paint) | How long the biggest visible element (hero image or heading) takes to render | Under 2.5s | 2.5s–4.0s | Over 4.0s |
| INP (Interaction to Next Paint) | How long the page takes to visibly respond after a click, tap, or keypress | Under 200ms | 200ms–500ms | Over 500ms |
| CLS (Cumulative Layout Shift) | How much visible content jumps around as the page loads | Under 0.1 | 0.1–0.25 | Over 0.25 |
INP replaced First Input Delay (FID) as the official interactivity metric in March 2024, and it's proven far less forgiving. FID only measured the delay before a browser started processing a click; INP measures the full round trip until the user actually sees a response. Industry-wide, INP is now the most commonly failed of the three vitals — a meaningful share of sites globally still don't pass it, and in our audits of Indian SME and mid-market sites, INP is usually the metric nobody has ever looked at, because most legacy SEO advice still fixates on load speed alone.
Why this now sits above "nice to have"
Three separate pressures are pushing Core Web Vitals up client priority lists in 2026, and they compound.
First, page experience remains what Google would call a light-touch ranking factor on its own — it won't rescue thin or irrelevant content — but it functions as a tiebreaker. When two pages are otherwise similar in relevance and authority, Core Web Vitals can be the difference between position three and position eight. Some SEO trackers are also reporting that a March 2026 core update began treating the three vitals as a composite score rather than three independent pass/fail checks, meaning passing two out of three and failing the third now carries a heavier penalty than before. We'd treat that specific claim as directional rather than confirmed, since Google doesn't publish algorithm internals — but the trend it describes matches what we're seeing in Search Console data across client accounts.
Second, AI Overviews and other AI-generated answers now sit above the organic results for a large share of informational queries, and they've measurably cut organic click-through rates on those queries. The pages that do get cited inside an AI Overview earn meaningfully more clicks than a traditional top-three ranking used to. Page experience is one of the quieter inputs into which pages get pulled into that citation — a fast, stable page is easier for Google's systems to parse and trust as a source.
Third, and most concretely: this directly taxes your paid media budget. Landing page experience feeds into Google Ads Quality Score, and Quality Score moves your cost per click. If you're running Google Ads into a slow landing page, you are — quite literally — paying a premium for the privilege of that slowness. This is the same "website that doesn't convert" bottleneck we flag on almost every marketing engagement: it doesn't matter how good the SEO or the ad copy is if the page underneath falls over before the visitor sees your offer.
The free 20-minute audit (do this first)
Before paying anyone for a performance audit, spend twenty minutes running your own. It won't fix anything, but it tells you whether you have a real problem and roughly where it lives.
- PageSpeed Insights (pagespeed.web.dev) — paste your URL. This gives you both real-user "field data" (from CrUX, if your site has enough traffic to qualify) and a synthetic "lab" score from Lighthouse. Field data is what actually affects rankings; lab data tells you why.
- Search Console → Core Web Vitals report — if you have Search Console connected, this shows how many of your indexed URLs pass or fail each metric, grouped by page template. This is the fastest way to see whether the problem is site-wide or confined to one template.
- Chrome DevTools → Lighthouse and Performance panels — right-click, Inspect, run a Lighthouse audit in Incognito mode (extensions skew results). The "Diagnostics" section names the specific offending elements — which image, which script, which font.
- GA4 or a RUM tool, if you have one — cross-reference performance against bounce rate and conversion rate by device. Mobile is almost always worse than desktop in India given the device and network mix, so segment by device before drawing conclusions.
What actually breaks on Indian business sites
Across the audits we run, the failure patterns are consistent enough to name.
LCP failures are almost always one of three things: an unoptimized hero image (a 4MB PNG doing a JPG's job), a render-blocking web font loaded before the hero text can paint, or a slow server response — cheap shared hosting or an unoptimized WordPress stack with no caching layer. Image and server-side fixes alone typically recover 40–60% of LCP time on sites that haven't been touched in this respect, and it's usually the cheapest fix on the list.
INP failures trace back to JavaScript: long tasks blocking the main thread (a chat widget, a WhatsApp click-to-chat script, an analytics or ad-pixel bundle all initializing on load), heavy click handlers doing DOM work synchronously, and third-party embeds added one at a time over several years without anyone auditing the cumulative weight. The fix is rarely "remove the feature" — it's breaking long tasks into smaller chunks, deferring non-critical scripts until after first interaction, and moving heavy processing off the main thread where possible.
CLS failures usually come from images and ads rendering without reserved dimensions (the classic "text jumps down as the image loads in"), web fonts swapping in and shifting line heights, and dynamically injected banners or cookie-consent widgets that push content down after the user has already started reading or tapping. These are typically the fastest and cheapest fixes on the list — reserving space with explicit width/height or aspect-ratio CSS closes most CLS gaps without touching a line of business logic.
Planning a Website? Don't Overpay or Underbuild
Most businesses overspend on features they don't need — or underspend and rebuild within a year. We help you scope it right from day one.
Realistic fix costs (India, 2026)
Cost tracks the depth of the fix, not the size of the business. A five-page marketing site and a 200-page e-commerce catalog can land in the same bracket if the underlying template is the problem.
| Service tier | What's included | Typical cost (INR) | Typical timeline |
|---|---|---|---|
| Basic Performance Audit | PageSpeed + CrUX + Lighthouse review, prioritized fix list, no implementation | ₹15,000 – ₹30,000 | 2–3 business days |
| Quick-Win Sprint | Image compression/formats, font-loading fixes, CLS dimension fixes, script deferral | ₹35,000 – ₹75,000 | 1–2 weeks |
| Deep Performance Sprint | Full INP remediation, third-party script audit, CDN/caching setup, server-side tuning | ₹75,000 – ₹1,50,000 | 2–3 weeks |
| Full Rebuild (Next.js/React) | New front-end architecture, automated image pipeline, edge caching, built-in monitoring | ₹3,00,000 – ₹12,00,000+ | 6–10 weeks |
Enterprise sites with complex personalization, multi-region delivery, or heavy legacy integration run above this range — that's a scoped IT consulting conversation, not a fixed sprint.
Decision framework: sprint vs rebuild
Run this quickly before committing budget either way.
- Site is under three years old, built on a reasonably modern stack (React, Next.js, a modern CMS), and fails one or two metrics → a Quick-Win or Deep Performance Sprint is almost always the right call. You're optimizing an architecture that's fundamentally sound.
- Site is on an aging WordPress theme-and-plugin stack, fails all three metrics simultaneously, or every fix recommendation traces back to "the theme does this" → a sprint will hit diminishing returns fast, and a rebuild on a modern stack pays back faster than repeatedly patching the same foundation.
- You're spending meaningfully on Google Ads and landing page Quality Score is visibly capping your CPC → prioritize the sprint immediately; the payback period is usually measured in weeks, not months, because you're recovering money you're already spending.
- The site is core to revenue (e-commerce, SaaS sign-up flow, lead-gen funnel) → treat this as an ongoing discipline, not a one-off project. Performance regresses every time a new script, banner, or integration gets added.
This maps directly to how we scope Core Web Vitals work inside our web development engagements — we run it as a discovery-first, two-week-sprint process with a working, measurable result (not a slide deck) at the end of each sprint, so you can see the CrUX numbers move before committing to the next phase.
What "good" actually buys you
The numbers vary by industry and traffic quality, but the direction is consistent across every study we've seen and every client account we've watched: faster, more stable pages convert more of the traffic you're already paying for. That's the part that gets missed when performance work gets deprioritized in favor of "more content" or "more ads" — you can spend your entire growth budget acquiring traffic that a slow page then quietly loses before it ever sees your offer. Fixing the leak is usually cheaper than growing around it.
Monitoring after the fix
Core Web Vitals aren't a one-time project — they regress. Every new tracking pixel, chat widget, marketing banner, or unreviewed plugin update chips away at whatever you just fixed. This is exactly why we bundle CWV monitoring into ongoing maintenance retainers rather than treating it as a project with an end date: real-user monitoring flags regressions before they show up in Search Console weeks later, and our standard retainer includes under-4-business-hour response on anything flagged as critical. The 30-day post-launch support window that comes standard with every build covers the initial stabilization period; the retainer is what keeps the numbers from drifting back to where they started six months later.
Related Articles
- Cost of Website Development in India in 2026: A Complete Pricing Guide — Web Development
- React.js vs Next.js in 2026: Which Should You Build With? — Web Development
- Conversion Rate Optimization (CRO) for Indian Business Websites in 2026 — Digital Marketing
- The No-Stress Web Engineering Journey: How We Ship On Time, Every Time — Web Development
Working With Us
If your Core Web Vitals report is sitting in amber or red and you're not sure whether you need a sprint or a rebuild, that's exactly the kind of question our free consultation is built for. We'll pull your real CrUX data, tell you honestly which bracket you're in, and give you a fixed-scope proposal — no vague "it depends." Our web development team runs Core Web Vitals work in the same two-week sprint cadence as every other engagement, with a measurable result at the end of each sprint. Book a free consultation and we'll tell you honestly what's broken and what it'll take to fix it.
Pro Insight
Core Web Vitals in amber or red?
We'll pull your real CrUX data, tell you honestly which bracket you're in, and give you a fixed-scope proposal — no vague "it depends."
- ✓SEO-first architecture
- ✓Conversion-focused design
- ✓High-speed performance
- ✓Scalable, future-proof code
📩 Response within 24 hours
Frequently Asked Questions
What are Core Web Vitals in 2026?
Core Web Vitals are three Google metrics that measure real-user page experience: LCP (loading speed), INP (responsiveness to clicks and taps), and CLS (visual stability). Google measures all three at the 75th percentile of real visitors over a rolling 28-day window, not a single lab test.
Do Core Web Vitals affect Google rankings?
Yes, but as a light-touch, tiebreaker-style signal rather than a primary ranking factor. They won't rescue thin or irrelevant content, but when two pages are otherwise comparable in relevance and authority, Core Web Vitals can decide which one ranks higher — and some evidence suggests failing multiple vitals is penalized more heavily than failing just one.
How do I check my website's Core Web Vitals for free?
Run your URL through PageSpeed Insights (pagespeed.web.dev) for real-user field data plus a lab-based Lighthouse score, and check the Core Web Vitals report inside Google Search Console if you have it connected — it shows pass/fail rates across your indexed pages by template.
What is a good INP score in 2026?
Under 200 milliseconds at the 75th percentile is “good.” Between 200 and 500 milliseconds needs improvement, and above 500 milliseconds is poor. INP has proven to be the hardest vital for most sites to pass since it replaced First Input Delay (FID) in March 2024.
How much does it cost to fix Core Web Vitals issues in India?
A basic audit runs ₹15,000–₹30,000. A quick-win sprint covering images, fonts, and layout shift runs ₹35,000–₹75,000. A deep sprint that also fixes INP and third-party script bloat runs ₹75,000–₹1.5L. A full rebuild on a modern stack starts around ₹3L and scales with complexity.
Can I fix Core Web Vitals myself, or do I need a developer?
Some fixes — compressing images, adding explicit width/height to images, lazy-loading below-the-fold content — are achievable through CMS settings or plugins on platforms like WordPress. INP fixes and deep third-party script audits generally require a developer who can read a JavaScript execution trace and safely restructure how scripts load without breaking functionality.