Quick Summary
- 1Core Web Vitals are still a confirmed Google ranking factor, and in 2026 INP — not raw load time — is what most Indian business sites fail first: 43% of sites still miss the 200ms threshold.
- 2The stakes are real: a one-second delay in load time can cut conversions by roughly 7%, and pages ranking #1 in Google are about 10% more likely to pass all three Core Web Vitals than pages sitting at position 9.
- 3Fixing a slow WordPress or Shopify site typically runs ₹15,000–₹40,000 in India; a full remediation on a custom React or Next.js application runs ₹40,000–₹1,50,000; architecture-level fixes for e-commerce or SaaS apps start around ₹1,50,000 and can exceed ₹5,00,000.
- 4This guide breaks down what's actually broken on most Indian business sites, which tools we use to diagnose it, and which fix matches which budget.
The bottleneck nobody notices until the data shows it
Every founder we talk to has heard “site speed matters for SEO.” Few have seen what it costs them in absolute numbers. We routinely open a client's Google Search Console and Chrome UX Report data and find qualified traffic landing on a page that takes four-plus seconds to become interactive — and bouncing before they see the offer. That's not a design problem. That's Core Web Vitals.
This guide is the one we wish more agencies would write: what Core Web Vitals actually measure in 2026, why the metric that matters most changed in 2024, what a realistic fix costs in India by site type, and the decision framework we use with clients before we ever propose a rebuild.
What “Core Web Vitals” means in 2026
Google grades three metrics, each measured at the 75th percentile of real user visits over a rolling 28-day window in the Chrome User Experience Report (CrUX) — not a single lab test.
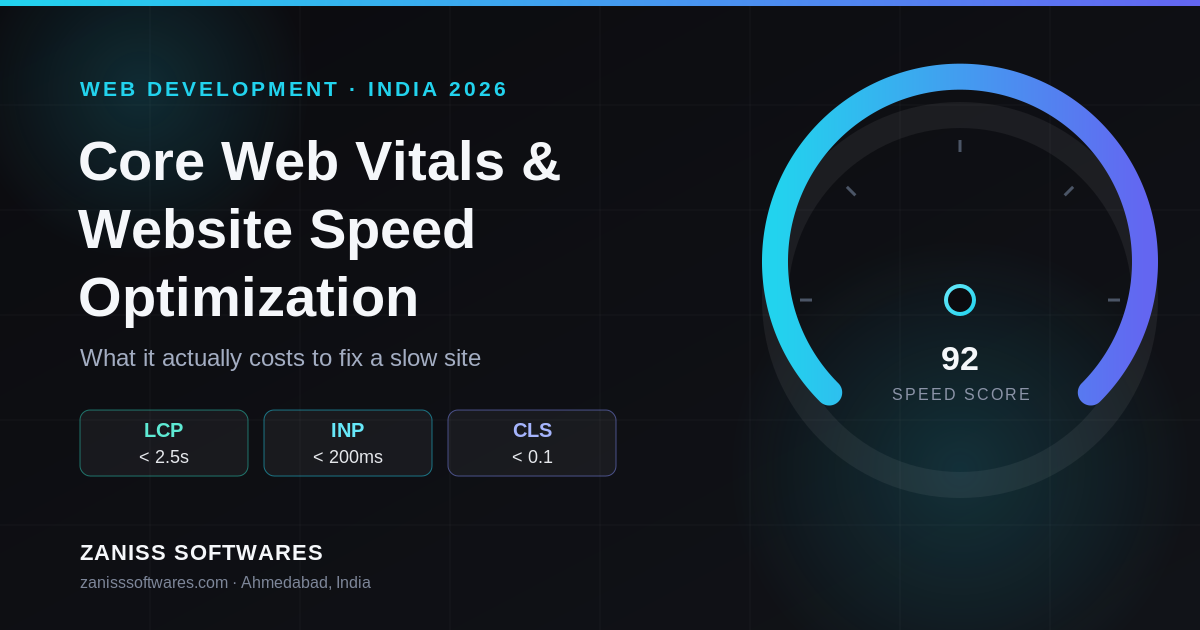
- Largest Contentful Paint (LCP) — how long the biggest visible element (usually a hero image or headline) takes to render. Good: under 2.5 seconds.
- Interaction to Next Paint (INP) — how quickly the page responds to a click, tap, or keypress, measured across the full visit. Good: under 200 milliseconds.
- Cumulative Layout Shift (CLS) — how much content jumps around as the page loads. Good: under 0.1.
The metric that trips up the most sites changed in March 2024, when INP fully replaced First Input Delay (FID) as Google's responsiveness metric. FID only measured the delay before the browser started processing the first interaction; INP measures the full cost of every interaction across the session, including ones deep into a page visit. That's a much harder bar to clear, and it shows: as of 2026 data, 43% of sites still fail the 200ms INP threshold, making it the most commonly failed Core Web Vital. If your last speed audit predates 2024, it's testing the wrong number.
Why it's worth fixing
Two separate arguments hold here, and we'd fix Core Web Vitals for either one alone.
SEO: Core Web Vitals have been a confirmed Google ranking signal since June 2021. Content and backlinks still carry more weight, but they're not the tiebreaker they used to be — pages ranking at position 1 are about 10% more likely to pass all three Core Web Vitals than pages sitting at position 9. If you're already investing in SEO or content, a failing CWV score is quietly capping the return on that spend.
Conversion: this is the number that actually moves revenue. A one-second delay in load time can reduce conversions by roughly 7%. Retail benchmarking has shown a 0.1-second improvement in load time lift conversion rate by 8.4% and average order value by 9.2%. One of the more striking published examples is Rakuten 24, which found that improving LCP alone produced a 53% increase in revenue per visitor and a 33% increase in conversion rate. We've seen smaller but directionally identical results on our own client sites — speed fixes are one of the few line items where the ROI shows up in analytics within weeks, not quarters.
If your site is one we'd flag in our CRO guide, Core Web Vitals should be the first thing you check before you touch a single button or headline. No amount of persuasive copy converts a visitor who never waited for the page to finish loading.
How we diagnose a slow site
We don't guess. Every engagement starts with the same toolchain:
- PageSpeed Insights (PSI) — combines lab data (Lighthouse) with real CrUX field data, and is the closest proxy to what Google actually sees.
- Chrome UX Report (CrUX) — the real-user dataset Google uses for ranking; available via BigQuery or the CrUX dashboard for site-level trends over time.
- WebPageTest — waterfall-level detail on exactly which request or script is blocking render.
- GTmetrix — useful for quick comparisons and historical tracking across audits.
- Chrome DevTools Performance panel — for INP specifically, this is where we find the actual JavaScript function eating the interaction budget.
Lab tools (Lighthouse, GTmetrix) tell you what's slow in a controlled test. Field tools (PSI's CrUX tab, the CrUX dashboard) tell you what your real visitors on real 4G connections in Tier 2 and Tier 3 India are actually experiencing — and those two pictures often disagree. We always quote against field data, because that's what Google ranks against.
The five causes we find on almost every Indian business site
- Unoptimized images. Hero banners exported at 3–4MB, uncompressed, with no responsive srcset — this alone is responsible for the majority of LCP failures we see.
- Bloated page-builder or theme JavaScript. WordPress sites running Elementor or similar builders often ship 1–2MB of JavaScript before a single line of actual content logic runs.
- Render-blocking third-party scripts. Marketing pixels, chat widgets, and analytics tags loaded synchronously in the <head> — five or six of these stacked is a common INP killer.
- Poor server response time (TTFB). Shared hosting with no caching layer, especially common on ₹3,000/year hosting plans, routinely returns TTFB above 800ms before the browser has downloaded a single byte of the page.
- No CDN, no lazy loading. Every asset served from a single origin server in one region, with below-the-fold images loading eagerly and competing with above-the-fold content for bandwidth.
None of these require a rebuild. Most require a focused two-to-three-week engagement.
Planning a Website? Don't Overpay or Underbuild
Most businesses overspend on features they don't need — or underspend and rebuild within a year. We help you scope it right from day one.
Decision framework: quick fix, standard remediation, or rebuild
We walk every client through the same three questions before quoting a number.
Is the underlying architecture sound? If the site is a modern framework (Next.js, a well-built WordPress install, Shopify) and the problems are configuration and asset-level, a quick fix or standard remediation resolves it. If it's a decade-old jQuery site with no build pipeline, patching it is often more expensive than migrating — see our React vs Next.js comparison for what a rebuild would look like.
Is INP failing because of your code, or a vendor's? If a third-party script (chat widget, ad tech, an embedded booking calendar) is the bottleneck, the fix is often replacing or deferring that vendor — not rebuilding your app.
What's the traffic and revenue at stake? A low-traffic brochure site doesn't need edge caching architecture. A checkout flow doing meaningful transaction volume justifies an architecture-level fix because the conversion math pays it back inside a quarter — the same logic we use to scope any custom software engagement.
What it actually costs
| Tier | What's included | Typical cost (India) | Typical cost (Global) | Timeline |
|---|---|---|---|---|
| Quick Fix | Image compression + lazy load, caching plugin, minify CSS/JS, remove unused plugins, basic CDN | ₹15,000 – ₹40,000 | $200 – $500 | 3–7 days |
| Standard Remediation | Full CWV audit, code splitting, font optimization, third-party script audit, image pipeline, CDN setup | ₹40,000 – ₹1,50,000 | $500 – $1,800 | 2–4 weeks |
| Architecture-Level Fix | SSR/ISR migration, edge caching, bundle restructuring, API/database latency fixes, monitoring setup | ₹1,50,000 – ₹5,00,000+ | $1,800 – $6,000+ | 4–8 weeks |
| Monitoring Retainer | RUM/CrUX dashboards, monthly regression checks, alerting on TTFB/LCP/INP creep | ₹8,000 – ₹25,000/month | $100 – $300/month | Ongoing |
Figures assume a typical small-to-mid-size business site (5–40 pages, moderate traffic). Complex e-commerce catalogs, high-traffic SaaS dashboards, and multi-region sites run toward the top of each range or beyond it — we scope those individually after a technical audit.
What we do differently
Every site we build at ZANISS ships Core Web Vitals-optimized by default — it's part of our standard web development process, not an add-on. Sub-2-second load time and passing INP/CLS scores are acceptance criteria before we call a sprint done, the same way functional bugs are. For sites we didn't build, we run the same audit toolchain above, hand you a prioritized fix list with real cost estimates against each item, and let you decide how much of it to do now versus later — we don't upsell a full rebuild when a two-week remediation sprint solves the actual problem.
If you're already a client, Core Web Vitals regression checks are part of our monthly maintenance retainer, with under-4-business-hour response if a deploy or a marketing team's new tracking pixel tanks your INP score.
A realistic timeline
Discovery and audit: 3–5 business days, delivered as a written report with prioritized fixes and cost against each. Quick-fix and standard-remediation work runs in our usual two-week sprint cadence, with a re-tested PSI/CrUX score at the end of each sprint so you can see the number move, not just take our word for it. Architecture-level work follows the same cadence across multiple sprints, with a working, measurably faster site at the end of each one.
Keep reading
- [Web Development] Cost of Website Development in India in 2026: A Complete Pricing Guide
- [Web Development] React.js vs Next.js in 2026: Which Should You Build With?
- [Digital Marketing] Conversion Rate Optimization (CRO) for Indian Business Websites in 2026: Framework, Tools and Real Cost
- [Web Development] Web Development Company in Ahmedabad: How to Choose One in 2026
Working With Us
If your site is failing Core Web Vitals — or you've never actually checked — start with a free audit conversation. We'll show you your real CrUX numbers, tell you honestly whether you need a two-week fix or a longer rebuild, and give you a fixed-scope quote before you commit to anything. Explore our web development service, or book a free consultation and we'll run the audit on your live site during the call.
Pro Insight
Failing Core Web Vitals — or never checked?
We'll show you your real CrUX numbers and give you a fixed-scope quote before you commit to anything.
- ✓SEO-first architecture
- ✓Conversion-focused design
- ✓High-speed performance
- ✓Scalable, future-proof code
📩 Response within 24 hours
Frequently Asked Questions
What are Core Web Vitals in 2026?
Core Web Vitals are three Google-measured metrics: Largest Contentful Paint (LCP, under 2.5 seconds), Interaction to Next Paint (INP, under 200 milliseconds, which replaced First Input Delay in March 2024), and Cumulative Layout Shift (CLS, under 0.1). Google scores all three at the 75th percentile of real visitor data over a rolling 28-day window in the Chrome User Experience Report, not a single lab test.
How much does it cost to fix Core Web Vitals in India?
A quick fix on an existing WordPress or Shopify site typically runs ₹15,000–₹40,000. A standard remediation on a custom-built site runs ₹40,000–₹1,50,000. Architecture-level fixes for e-commerce or SaaS applications start around ₹1,50,000 and can exceed ₹5,00,000 depending on scope.
Does site speed really affect Google rankings?
Yes, though it's a secondary signal. Core Web Vitals have been a confirmed ranking factor since June 2021, and pages in position 1 are about 10% more likely to pass all three metrics than pages at position 9. Content relevance and backlinks still matter more, but a failing score caps how much of your SEO investment converts into rankings.
How long does Core Web Vitals optimization take?
Audit and diagnosis takes 3–5 business days. A quick fix or standard remediation typically completes in one to two 2-week sprints. Architecture-level fixes — SSR migration, CDN restructuring — run across multiple sprints, usually 4–8 weeks total.
Can I fix Core Web Vitals myself, or do I need a developer?
Basic wins — image compression, enabling a caching plugin, removing unused plugins — are achievable without a developer on WordPress or Shopify. INP failures caused by JavaScript execution, third-party scripts, or framework-level rendering choices generally need a developer who can read a Chrome DevTools performance trace, not just install a plugin.
How often should I monitor Core Web Vitals after fixing them?
Monthly, at minimum. Scores regress silently — a new marketing pixel, an unoptimized blog header image, or a plugin update can push INP or LCP back into “needs improvement” without anyone noticing until rankings or conversion drop. We run this as a standing check under our maintenance retainers specifically because it's the kind of regression nobody catches until it's already cost traffic.